Optics & Photonics / Case study
Photonic Coupling & Assembly Tolerance
A Python simulation study connecting SiN edge-coupler mode design, optical coupling, alignment tolerance and assembly yield.
- Photonics
- Numerical Modelling
- Monte Carlo
- Python
Key result
The author reports a modelled best UHNA7 fibre-coupling loss of 0.43 dB at a 250 nm tip. For two such tips, the simulated 1 dB lateral misalignment radius is about 0.7 µm.
Limitations at a glance
The scalar model omits full-vector polarisation effects, Fresnel reflections, substrate leakage, taper-transition loss and facet roughness. Predictions near cutoff, especially below a 170 nm tip, are uncertain.
Read all limitations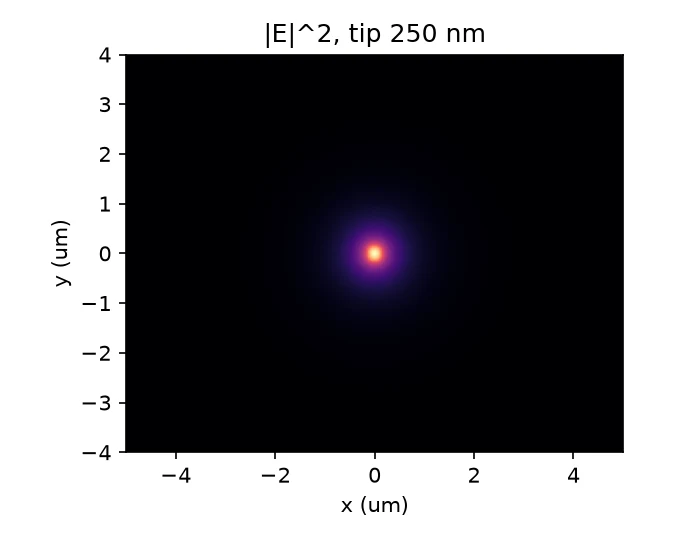
Problem
An edge coupler cannot be judged by nominal coupling alone: alignment and process variation affect whether it can be assembled reliably. This study connects mode design to fibre-to-chip and chip-to-chip packaging trade-offs.
Data or modelled system
A modelled silicon-nitride inverse taper in silica cladding is studied at 1550 nm. The reference setup uses 300 nm SiN thickness and refractive index 1.98. Tip width, placement offset, chip gap and process variation are simulation inputs, not measurements of fabricated devices.
Implementation
A scalar finite-difference mode solver calculates guided modes. Overlap calculations estimate fibre coupling, angular-spectrum propagation estimates chip-to-chip sensitivity, and Monte Carlo sampling explores assembly yield. A Gaussian-process surrogate explores tip-width and thickness variation.
Separate scripts investigate an expanded-beam micro-optic relay and generate a test-chip design-of-experiments layout. The layout is a design output, not evidence of fabrication.
Approach / workflow
Check the mode solver against an exact slab solution; sweep taper tips to examine mode size and coupling; vary lateral offset and gap; then sample placement and process assumptions to connect nominal design with packaging tolerance.
Explore a micro-optic relay as an alternative coupling arrangement. Its ray-based spot metrics must not be treated as a direct single-mode coupling-loss measurement.
Evaluation
Repository tests compare selected calculations with analytical or known physics results. This offers numerical checks within the chosen model, not full-vector or experimental validation.
All loss and yield values are simulated under stated assumptions. Process distributions are illustrative and are not foundry characterisation data.
Results
The author reports a modelled best UHNA7 fibre-coupling loss of 0.43 dB at a 250 nm tip. For two such tips, the simulated 1 dB lateral misalignment radius is about 0.7 µm.
Illustrative Monte Carlo assembly yield at a 1 dB specification is reported as 96%, 56% and 19% for independent Gaussian placement offsets with standard deviations of 0.25, 0.5 and 1 µm per axis respectively (20,000 draws per setting). Yield is the fraction of simulated assemblies meeting the 1 dB coupling-loss limit. These are simulated yields, not measured manufacturing outcomes; no independent reproduction is claimed.
Limitations
The scalar model omits full-vector polarisation effects, Fresnel reflections, substrate leakage, taper-transition loss and facet roughness. Predictions near cutoff, especially below a 170 nm tip, are uncertain.
The study uses illustrative process assumptions. Fabrication and measurement remain future work; this transparent Python model is not claimed to be equivalent to commercial photonics simulation software.
Repository and reproducibility
The MIT-licensed public repository provides the environment, solver and study commands, tests, figures, layout generation and relay exploration. Its documented workflow includes Python 3.10+ and automated checks on Python 3.10 and 3.12.